The BZB UAS team carried out test flights with the AiLF U10 sensor to demonstrate remote measurement of methane emissions using devices mounted on unmanned aircraft (drones). The results of the test flights are presented below. The flights were carried out in accordance with the Polish Civil Aviation Authority regulations on flying unmanned aircraft.
Where were the flights carried out?
We carried out the survey over the BZB UAS headquarters in the Sołtysowice district of Wrocław. The immediate surroundings are well suited to drone surveys with both multirotors and fixed-wing aircraft. The only obstacles around the buildings are trees and a single medium-voltage power line. Take-off sites for a multirotor are available across the whole BZB UAS site. The leak was simulated with an open cylinder of calibration gas.
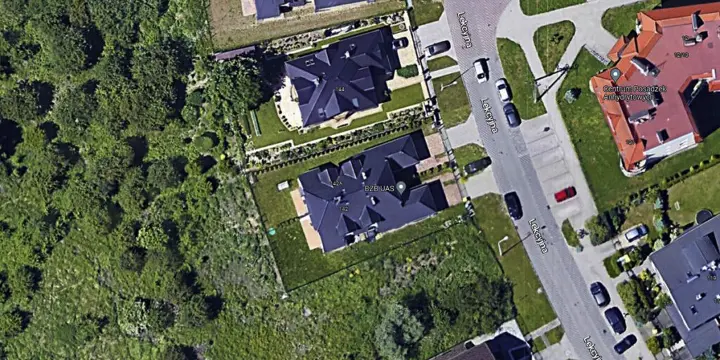
Figure 1 BZB UAS GPS coordinates 51.15303, 17.06362
Weather conditions during the work
During the work the weather was favourable and allowed drone operations. Wind speed needs particular attention, as it significantly affects the ability to detect gas and the precision of locating a leak.
- Temperature: 7°C
- Cloud cover: none
- Wind speed: 5 m/s (gusts up to 10 m/s)
- Humidity: 75%
We carried out the surveys on a windy day. Wind significantly affects the quality and precision of measurements. During every measurement and analysis of the results we took into account wind speed and direction and the influence of any terrain obstacles,
Reducing the flight speed increases the probability of detecting methane emissions in real time, but makes the scan of the whole area longer. Reducing the speed and tightening the flight grid increase the certainty of detecting a potential gas leak.
Methods and equipment used
The measurement method uses the AiLF U10 sensor. It uses a dedicated laser to detect and quantify methane from a distance of up to 100 metres and at concentrations from 5 ppm. The sensor uses the properties of methane to take precise measurements. Unlike optical cameras, it allows quantitative measurement of methane concentration.
The sensor works on the basis of the linear relationship between the concentration and the absorbance of a medium. This makes it possible to calculate the concentration by measuring the absorbance (the Beer–Lambert law). The sensor uses a laser with a wavelength of exactly 1653 nanometres, which means it is absorbed only by methane and other gases in the atmosphere do not affect it.
The measurement consists of measuring the intensity of the returning laser beam. The difference in intensity is then related to the gas concentration. The result of the laser measurement is a concentration in ppm.m. For example, a result of 100 ppm.m means that the laser passed through a uniformly distributed gas with a concentration of 100 ppm in a gas column 1 metre thick. The principle is also shown in Figure 2.
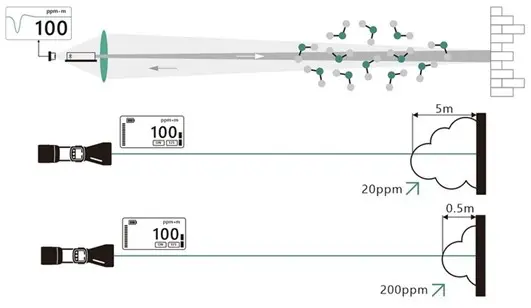
Figure 2 How the AiLF U10 sensor works
Survey parameters
We collected the laser data with the DJI Matrice 300 RTK unmanned aircraft equipped with the sensor AiLF U10.
Characteristics of the collected data:
- Flight altitude: 55 m (flight 1), 35 m (flight 2) and 45 m (flight 3)
- Number of flights: 3
- Flight speed: ~10 km/h
- Grid spacing: 5 m (flight 1), 4 m (flight 2), 4 m (flight 3)
- No information on the size of the controlled leak
Data presentation
Laser sensor
The measured area was divided into sectors. Places of potential leaks and methane emissions were marked with a number and a colour. The number shows the gas concentration in ppm*m. The colours depend on the gas concentration (Fig. 3).
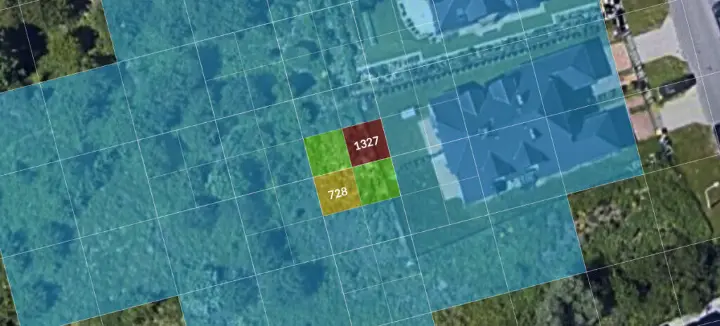
Figure 3 Example result of a methane concentration measurement
Interpretation of the data and description of the situation
During the first survey the “controlled leak” was set to its maximum value. During the automatic flight at an altitude of 55 m AGL, a reading of 1327 ppm.m was detected. The survey was then repeated over the same area but at an altitude of 35 metres. This time two readings were detected: the first with the same value as during the first flight and the second with a value of 728 ppm.m. During the last flight the “controlled leak” was reduced and the flight was carried out at an altitude of 45 metres. As in the previous surveys, the sensor detected the place where the gas concentration exceeded the set threshold (50 ppm.m).
Table 1 summarises the results from the laser sensor. It shows the highest reading observed within a 0.5 s time unit.

Table 1 Summary of measurements from the AiLF U10 laser sensor
When an alarm is triggered, the detection accuracy is ± 1.5 m and results from the positioning accuracy of the built-in GNSS receiver. Note that the sensor records the gas concentration only along its flight path. A reading therefore does not show the location of the leak, only the place where the sensor detected the gas.
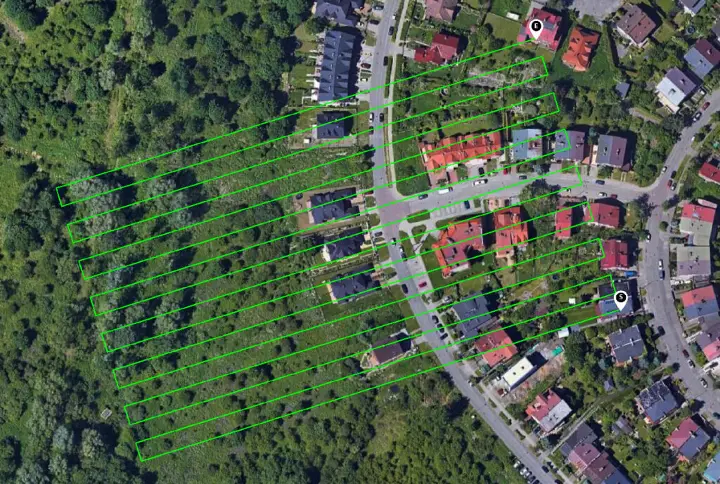
Figure 4. Flight path with the AiLF U10 sensor
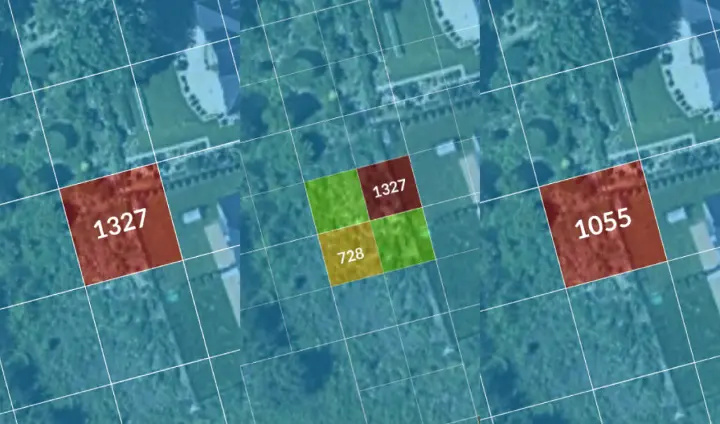
Figure 5. Close-up of the detected gas leaks: flight 1, flight 2, flight 3.
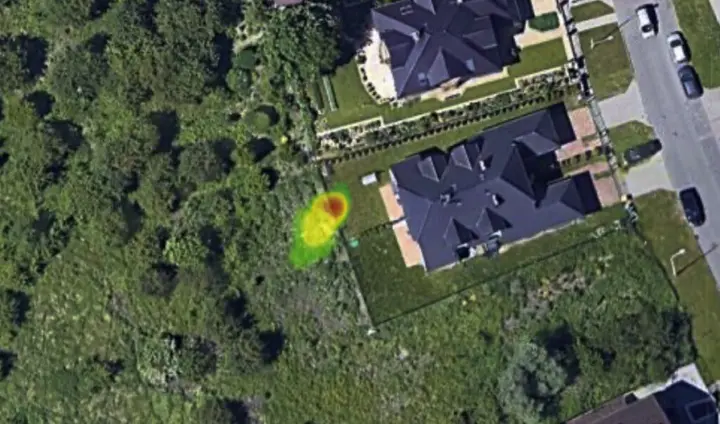
Figure 6. Close-up of the detected leak as a heat map
Quantitative leak values
The methodology adopted by BZB UAS is based on a statistical model and uses the normal distribution to formulate assumptions about the methane emission area. The following thresholds were adopted:
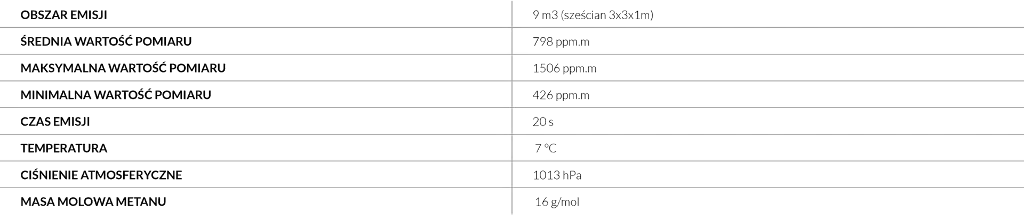
Based on the above data we calculated an average gas concentration of 831.41 mg/m3 . Taking the thresholds into account, we calculated the leak at 1.7 m3/h
This is only an estimate based on three surveys. To determine the readings more precisely with the AiLF laser sensor, more surveys are needed to set fixed thresholds on which the quantitative leak value will be calculated. The controlled leak was 1.1 kg/h, which corresponds to 1.5 m3/h at a pressure of 1013 hPa and a temperature of 7 °C.*
*The gas density was calculated with the online tool: https://www.unitrove.com/engineering/tools/gas/natural-gas-density
Assessment of the sensor
The LDAR model assumes identifying every element of the infrastructure that could potentially cause a leak. Using this information, the drone can be programmed to focus on these elements. In addition, the sensor lets you set a limit (in line with the definition of a leak) above which a measurement is classed as a leak. During the measurement the drone records the position of the detected leak. With information about the monitored infrastructure elements and their locations, a leak can be linked to a list of elements to check. This way of measuring significantly speeds up leak detection and infrastructure checks. Once the sensor has identified a leak, the area that needs checking is narrowed down, which shortens the response time to leaks.